
ERDC/CHL CETN-IV-27
September 2000
elevation
0.0
N
-2.0
-4.0
-6.0
-8.0
-10.0
-12.0
-14.0
-16.0
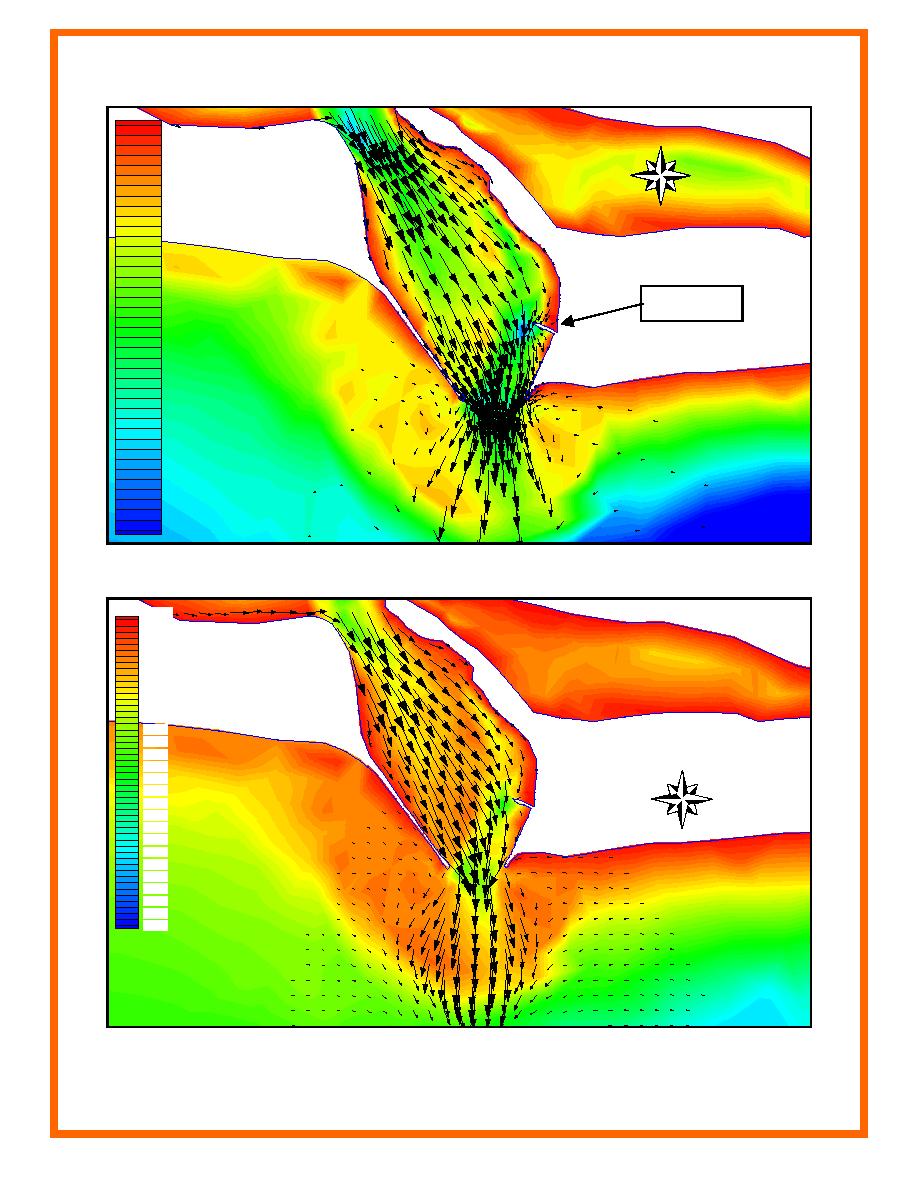
Spur Jetty
-18.0
-20.0
-22.0
-24.0
-26.0
-28.0
-30.0
-32.0
-34.0
-36.0
-38.0
-40.0
Figure 7. Velocity vector plot overlaid on contours of bathymetry (units in ft) (To convert feet to meters,
multiply by 0.3048)
Elevation (ft)
0.0
-3.0
-6.0
-9.0
-12.0
-15.0
-18.0
-21.0
-24.0
-27.0
-30.0
-33.0
N
-36.0
-39.0
-42.0
-45.0
-48.0
-51.0
-54.0
-57.0
-60.0
-63.0
-66.0
-69.0
-72.0
-75.0
Figure 8. Gridded velocity vector plot overlaid on contours of bathymetry (units in ft) (To convert feet to
meters, multiply by 0.3048)
7

 Previous Page
