
ERDC/CHL CETN-IV-27
September 2000
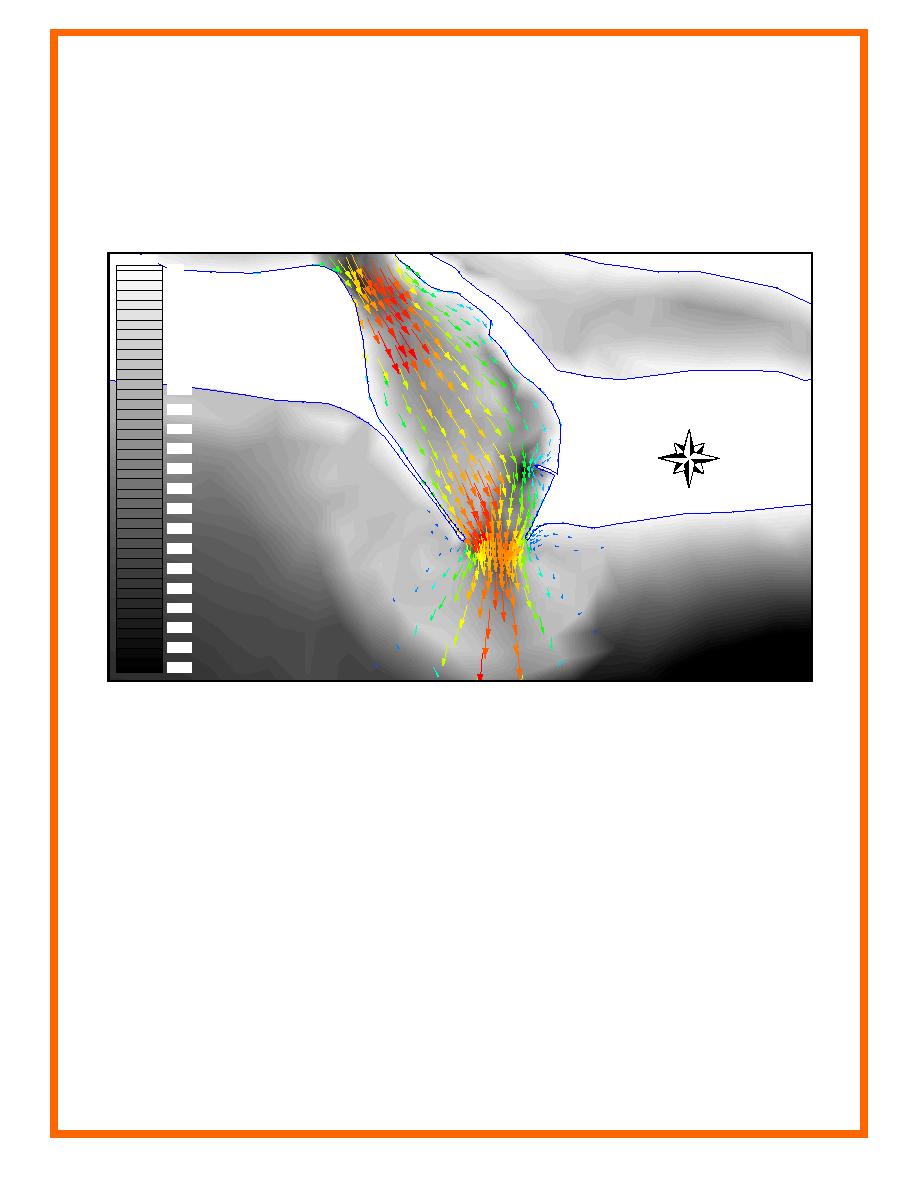
magnitude and the bathymetry becomes apparent. For example, the acceleration following the
northernmost constriction is due to a broad shoal located on the west side of the channel. Also,
the acceleration located on the west side of the channel before the flow exits is attributed to the
shallow water on the west side and the deep channel on the east. Figure 10 combines the
detailed magnitude information contained in Figure 9 with the bathymetry information contained
in Figure 7.
elevation
0.0
-2.0
-4.0
-6.0
-8.0
-10.0
-12.0
-14.0
N
-16.0
-18.0
-20.0
-22.0
-24.0
-26.0
-28.0
-30.0
-32.0
-34.0
-36.0
-38.0
-40.0
Figure 10. Color velocity vector plot overlaid on contours of gray scale bathymetry (units in ft) (To
convert feet to meters, multiply by 0.3048)
MANIPULATION OF OUTPUT: Often, hydrodynamic simulations are performed to evaluate
engineered modifications or to evaluate shoaling or scouring trends in a particular area. This
section discusses aids that can be developed for arriving at conclusions about these actions by
creating plots from the manipulation of the default model output.
Comparison Plots
Comparison plots allow the modeler to detect differences in solutions from two simulations and
thereby evaluate the consequences of project alternatives. To illustrate this capability, flow
conditions are compared with alternative spur jetty configurations; serving as the base
conditions, the spur is oriented perpendicular to the eastern shore (see Figure 7), whereas the
spur is oriented parallel to the shoreline for the alternative configuration. As shown in Figures 7
through 10, the spur deflects the flow towards the center of the inlet; however, a large scour hole
has formed at its tip. The alternative, shown in Figure 11, reorients the spur to present less of a
flow obstruction to reduce tip scour and still protect the shoreline.
9

 Previous Page
