
ERDC/CHL CETN-IV-27
September 2000
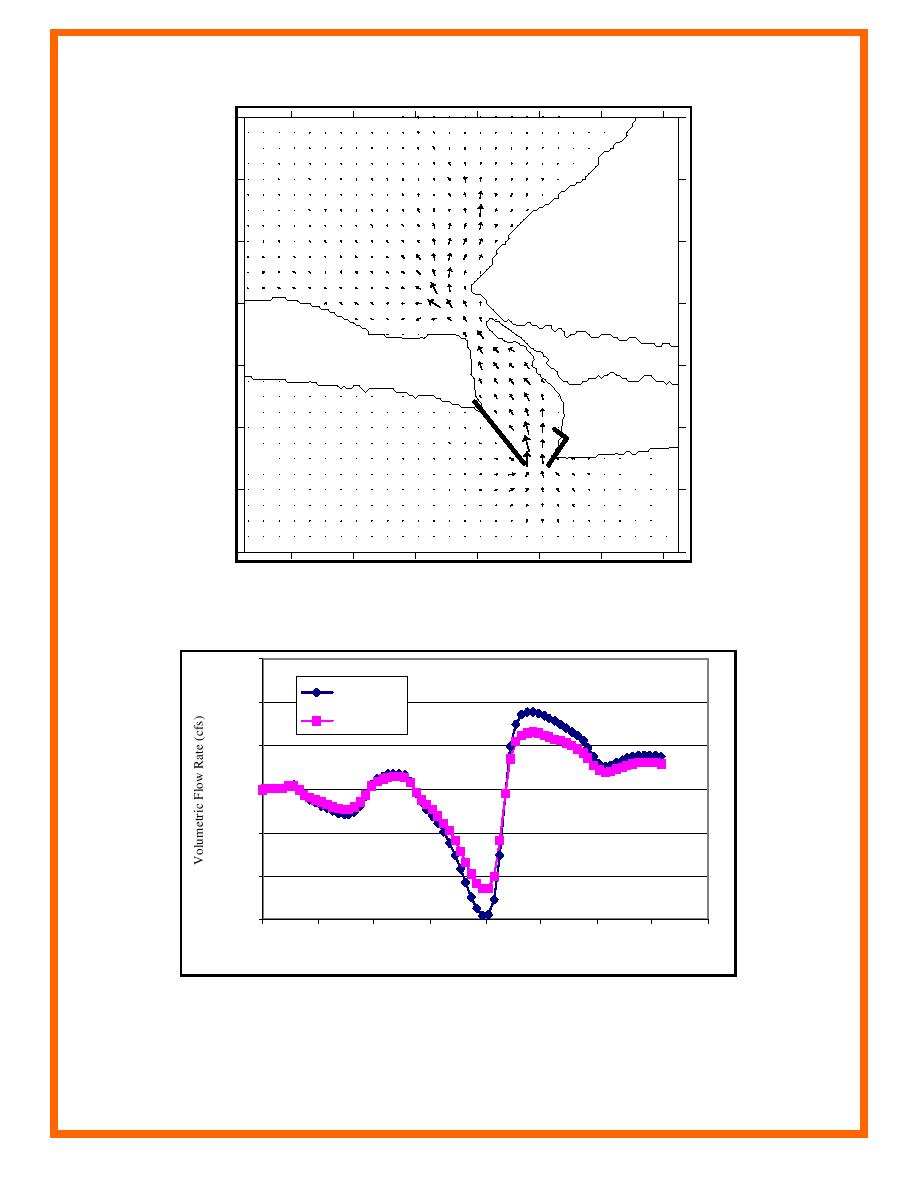
Figure 1. A traditional black and white velocity vector plot that
provides a qualitative picture of the entire system, but not specific
causal relationships between flows and bathymetry
30,000
Q(bridge)
20,000
Q(south)
10,000
0
-10,000
-20,000
-30,000
0
5
10
15
20
25
30
35
40
T ime (hrs)
T me (hr)
Figure 2. A traditional discharge time-history plot that provides point-specific,
quantitative information, but fails at providing a picture of the flow conditions over
the entire domain (Volumetric flow rate is in cubic feet per second. To convert to
cubic meters per second, multiply by 0.3048)
2

 Previous Page
