ERDC/CHL CETN-IV-27
September 2000
12
10
8
6
4
2
0
0
5
10
15
20
25
30
35
40
Time (hr)
Time (hours)
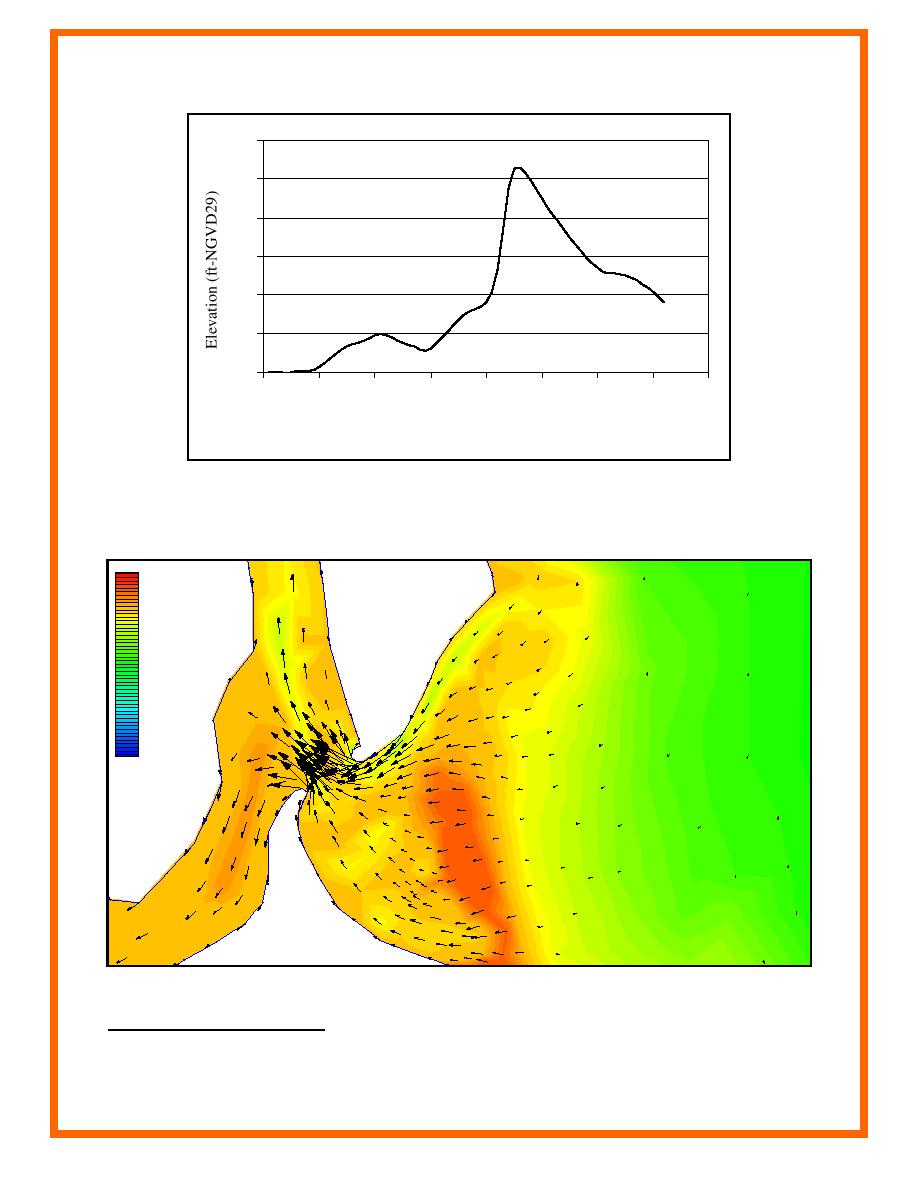
Figure 3. A traditional elevation time-history plot that provides point-specific,
quantitative information, but does not give a picture of the flow conditions
1
over the entire domain
elevation
14
6
-2
-10
-18
-26
-34
-42
-50
-58
-66
-74
-82
Figure 4. A false-color bathymetry filled contour plot with velocity vector overlay plot (units in ft) that
illustrates causal relationships between velocity and bathymetry
1
All elevations (el) cited herein are in feet referenced to the National Geodetic Vertical Datum
(NGVD) (To convert feet to meters, multiply by 0.3048).
3


 Previous Page
