
ERDC/CHL CETN-IV-27
September 2000
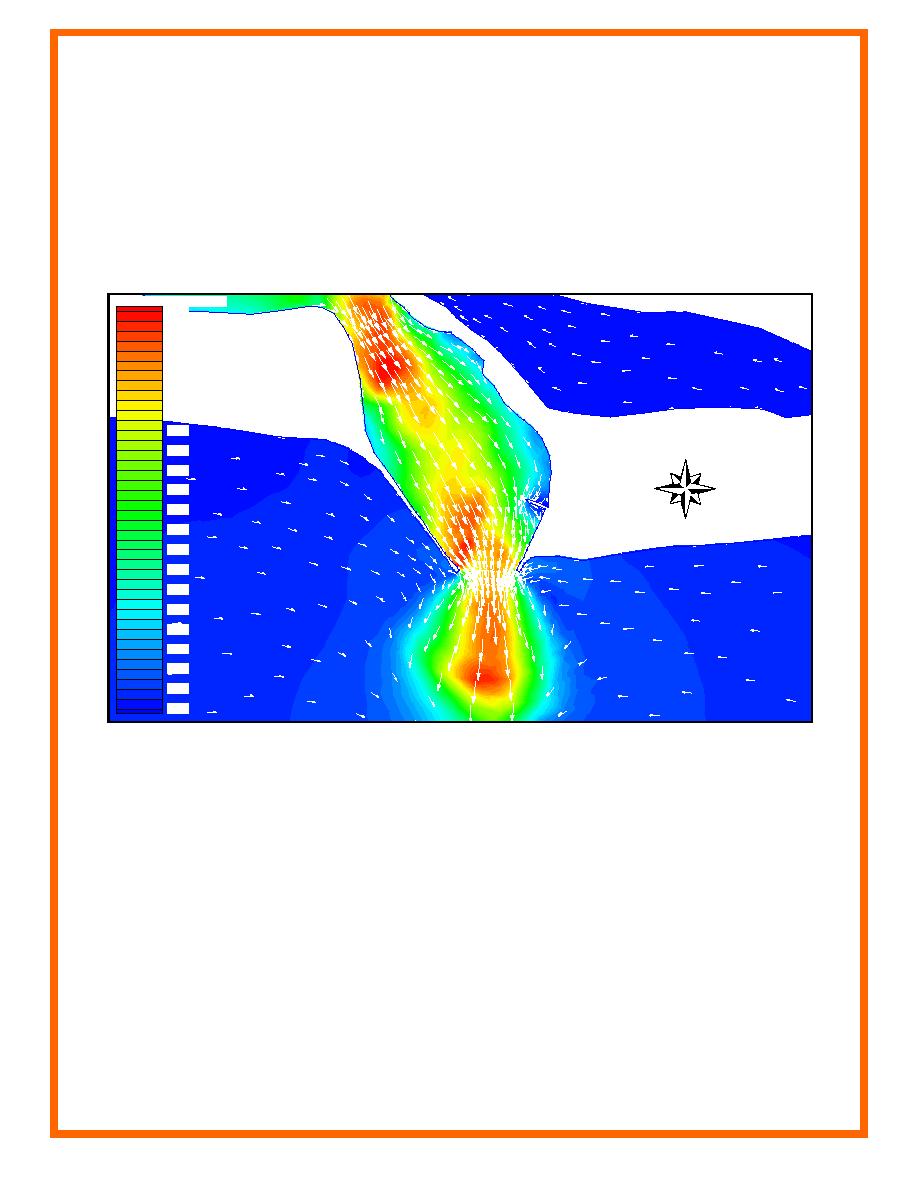
To better comprehend the velocity variation within the channel, Figure 9 illustrates a vector plot
overlaid on a contour plot of velocity magnitude. The contour plot shows many of the same
techniques discussed with the previous figure. The contour plot employs the psychological
association of the cooler (blue) colors with inactivity (lower velocities) and hot colors (red) with
activity (higher velocities) by reversing the default color scale. The vector lengths were rescaled,
compared to Figure 7, to display the underlying color contours. Also, the lowest magnitude
vectors were set to a finite length to show behavior in regions of low velocity. Finally, the
vectors were set to white to provide contrast with the darker contours.
velocity mag 1 : 301.500
4.21
4.00
3.79
3.58
3.37
3.16
2.95
N
2.74
2.52
2.31
2.10
1.89
1.68
1.47
1.26
1.05
0.84
0.63
0.42
0.21
0.00
Figure 9. Velocity vector plot overlaid on contours of velocity magnitude (units in ft/s) (To convert feet to
meters, multiply by 0.3048)
Figure 9 gives much more insight into the velocity variation in the channel as compared to
Figure 7. Apparent from the figure, a region of acceleration occurs at the north end of the
channel just south of the constriction. Next, flow decelerates as it enters the widening channel.
Before exiting, the flow accelerates again, but only on the west side of the channel. Another
notable feature displayed is the entrainment into the ebb jet that extends along the shoreline on
either side. This feature could only be resolved by setting a minimum vector length.
Figure 9, however, has lost the capability for distinguishing the cause-and-effect relationship
between the flow and the bathymetry. Figure 10 reintroduces this capability. The figure
displays a gray scale contour plot of bathymetry overlaid with a velocity vector plot. The vector
length and color are proportional to the velocity magnitude. The velocity vector color scale
employs the same variation as the contours in Figure 9. Notably, the eye is directly drawn to the
regions of interest in red. By this graphical means, the relationship between the velocity
8

 Previous Page
