
ERDC/CHL CETN-IV-27
September 2000
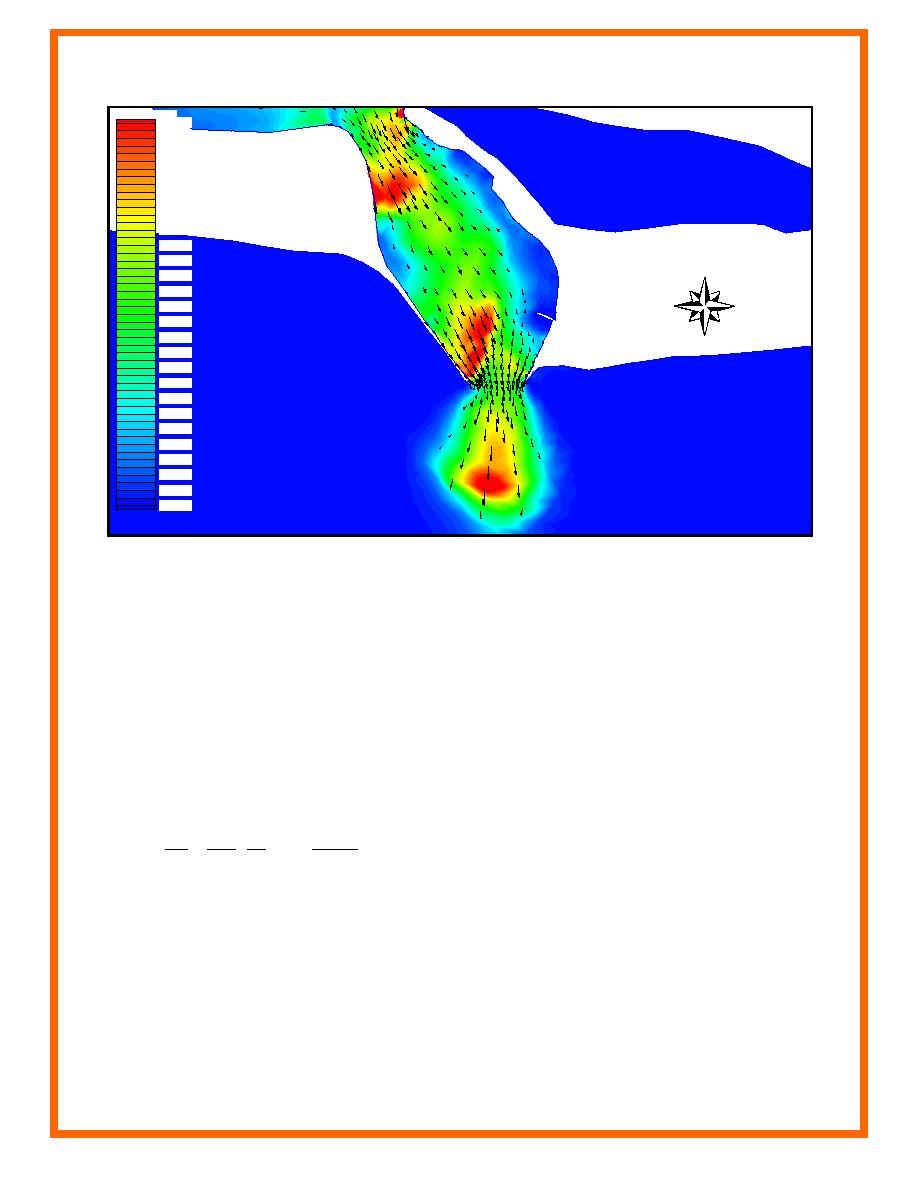
Shear Stress
0.0800
0.0768
0.0736
0.0704
0.0672
0.0640
0.0608
0.0576
0.0544
0.0512
N
0.0480
0.0448
0.0416
0.0384
0.0352
0.0320
0.0288
0.0256
0.0224
0.0192
0.0160
0.0128
0.0096
0.0064
0.0032
0.0000
2
Figure 12. Contours of shear stress overlaid with shear stress vectors (units in lbs/ft )
Figure 12 clearly shows the regions of increased shear stress (in red) and thus increased sediment
transport. The combination of high velocity and shallow water over the west interior shoal in the
channel at both the north and south end and over the ebb shoal cause large shear stresses at the
bed.
Calculating the sediment transport directly via a total load function produces a more rigorous
assessment of sediment transport. Figure 13 shows contours of sediment transport magnitude
calculated with the Ackers-White (1973) total load formula. To perform the calculations,
velocities computed by the hydrodynamic model were written to an ASCII file. Next, sediment
transport was calculated by the following equation:
p
m
Qs D35 V
F - A
C1
=
(4)
u
A
d *
Vd
where Qs is the time mean sediment transport rate of the sediment, d is the local depth, u* is the
comprising the bed is finer by weight. The variables p, m, F and A are functions of the flow and
sediment parameters as defined subsequently. The parameter F is given by the equation
12

 Previous Page
