
ERDC/CHL CHETN-I-69
March 2005
specify the spreading index and the maximum cutoff angle. Recommended value for the cutoff angle
is three times the standard deviation of the directional distribution.
Probes: The BOUSS-2D model can output the histories of the computed water-surface ele-
i.
vation, velocities, and pressure at every grid point and at every time-step. However, due to the
number of data points in the domain, this is usually done at intervals of 15-30 min. In order to
provide a more complete temporal representation of the results of the calculation, the model allows
the user to specify probes. At a probe location (x,y,z) the user can specify what data should be saved
and at what temporal resolutions. The options include water surface, u-velocity, v-velocity and
pressure.
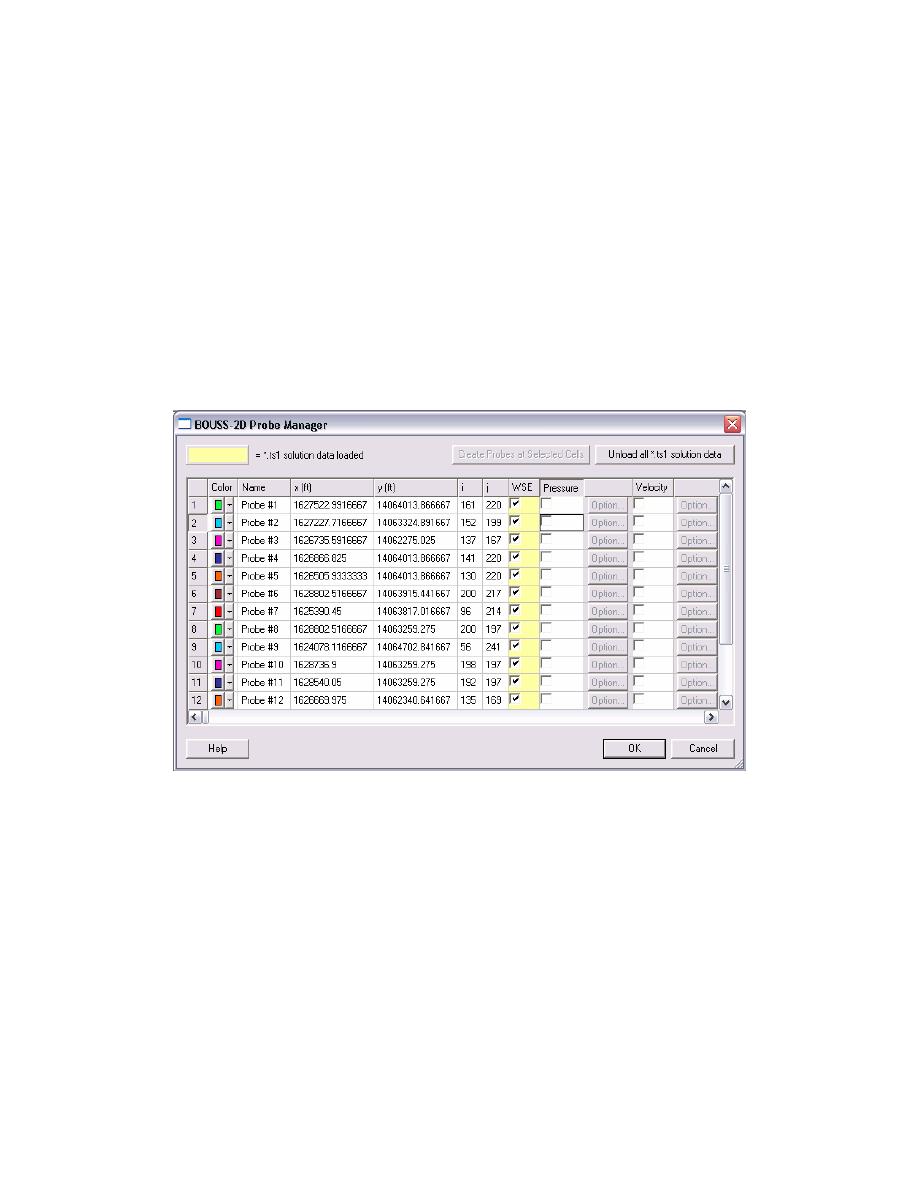
(1) The probe manager. The BOUSS-2D Probe Manager (Figure 11) manages creating, editing,
and deleting probes. This dialog is only accessible when a BOUSS-2D grid exists. To access the
BOUSS-2D Probe Manager, select the BOUSS-2D | Probe Manager menu item.
Figure 11. Probe Manager
The properties associated with probes are managed in a spreadsheet. These properties are described
as follows:
(a) Color. Each probe has a color associated with it. When a probe is created, this color is ran-
domly assigned, but can be changed at any time. A probe is displayed in the main graphics window
in the color assigned to it. After a BOUSS-2D simulation has been run, *.ts1 solution data can be
loaded. The probe's color is used on the plots of the *.ts1 solution data. This color is also used when
plotting the results of the Spectral Analysis utility. Currently, the color is not saved to BOUSS-2D
input files. When the *.par file is read in, colors are again randomly assigned.
(b) Name. Each probe has a unique name. When a probe is created, a name is assigned by
default, but can be changed at any time. The name is used in the legends of the plots of the *.ts1
15

 Previous Page
