
ERDC/CHL CHETN-I-69
March 2005
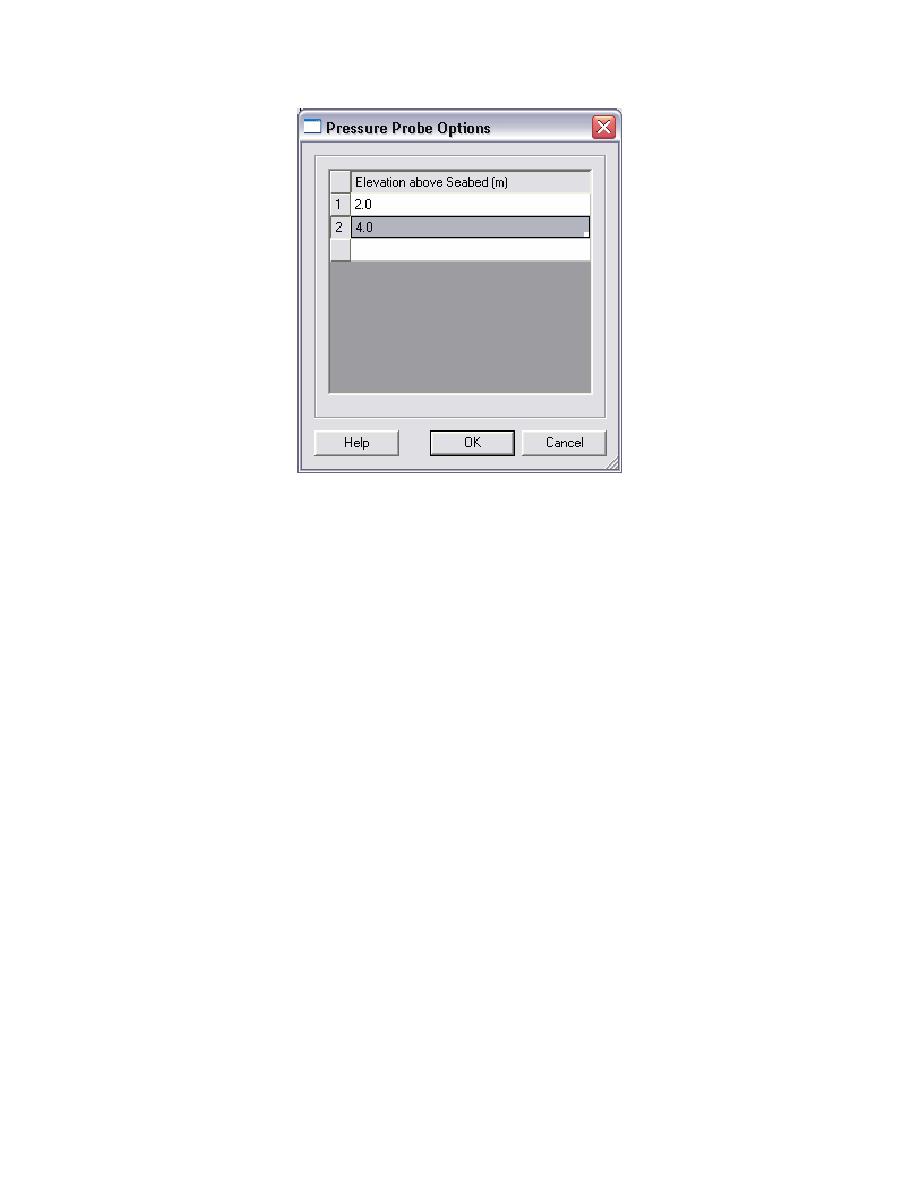
Figure 12. Pressure/Velocity Probe Options
(2) Creating probes. The spreadsheet in the BOUSS-2D Probe Manager always ends with a
blank line. This blank line is for creating a new probe. To create a new probe, assign the new probe a
name and either an x, y location or and i, j location. After the name and location of the probe has
been specified, the other parameters can be set as desired.
To simplify the creation of probes, the user can click the Create Probes at Selected Cells button.
This button is only enabled when grid cells have been selected with the Select Cell tool prior to
opening the BOUSS-2D Probe Manager. When this button is clicked, new probes are created at the
selected cells and the Create Probes at Selected Cells button is disabled.
(3) Editing probes. The properties of probes can be edited at any time.
(4) Deleting probes. A probe is deleted by selecting an entire row of the spreadsheet where probe
is defined, and by pushing the Delete key on the keyboard. The Shift and Ctrl keys on the keyboard
can be used in combination with the Delete key to delete multiple probes.
j.
BOUSS-2D can be visualized on the grid or in frequency space as appropriate.
(1) Visualizing spatial results. The grid or XMDF result files from the BOUSS-2D simulation
can be displayed inside of SMS. These can be visualized with the general tools in SMS, which allow
users to create images and plots of the calculated wave information in the model domain. These
include:
(a) Contour plots of wave height and direction for the entire modeling area or a subarea
(b) Vector plots of wave direction and radiation stress for the entire modeling area or a subarea
17

 Previous Page
