
ERDC/CHL CHETN-I-69
March 2005
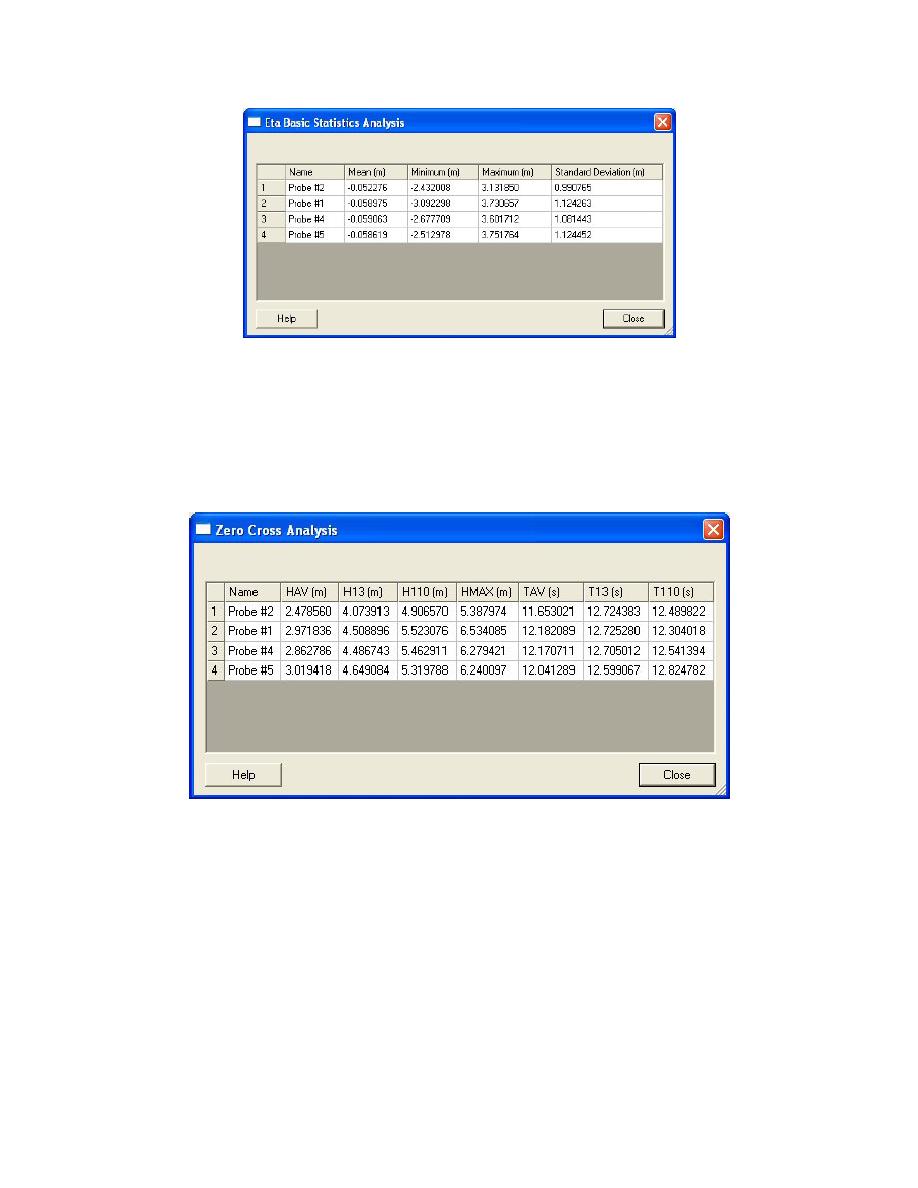
Figure 14. Basic statistics analysis results
(b) Zero-crossing analysis. This utility is available for only water-surface elevation (eta) time
series and calculates the average wave height(Have), the highest third of all wave heights (H1/3), the
highest tenth of all wave heights (H1/10), the maximum wave height (Hmax), the average period (Tave),
the longest third of all periods (T1/3), and the longest tenth of all periods (T1/10) for the scalar time
series. All units are in metric.
Figure 15. Zero-crossing analysis results
(c) Spectral analysis. This utility is available for only water-surface elevation (eta) time series.
The user specifies the value for the degrees of freedom (DOF) to be used (default=30). The plot
color(s). The spreadsheet displays the average energy density, significant wave height, and peak
period for each probe. All units are in metric.
19

 Previous Page
