
ERDC/CHL CHETN-I-70
May 2005
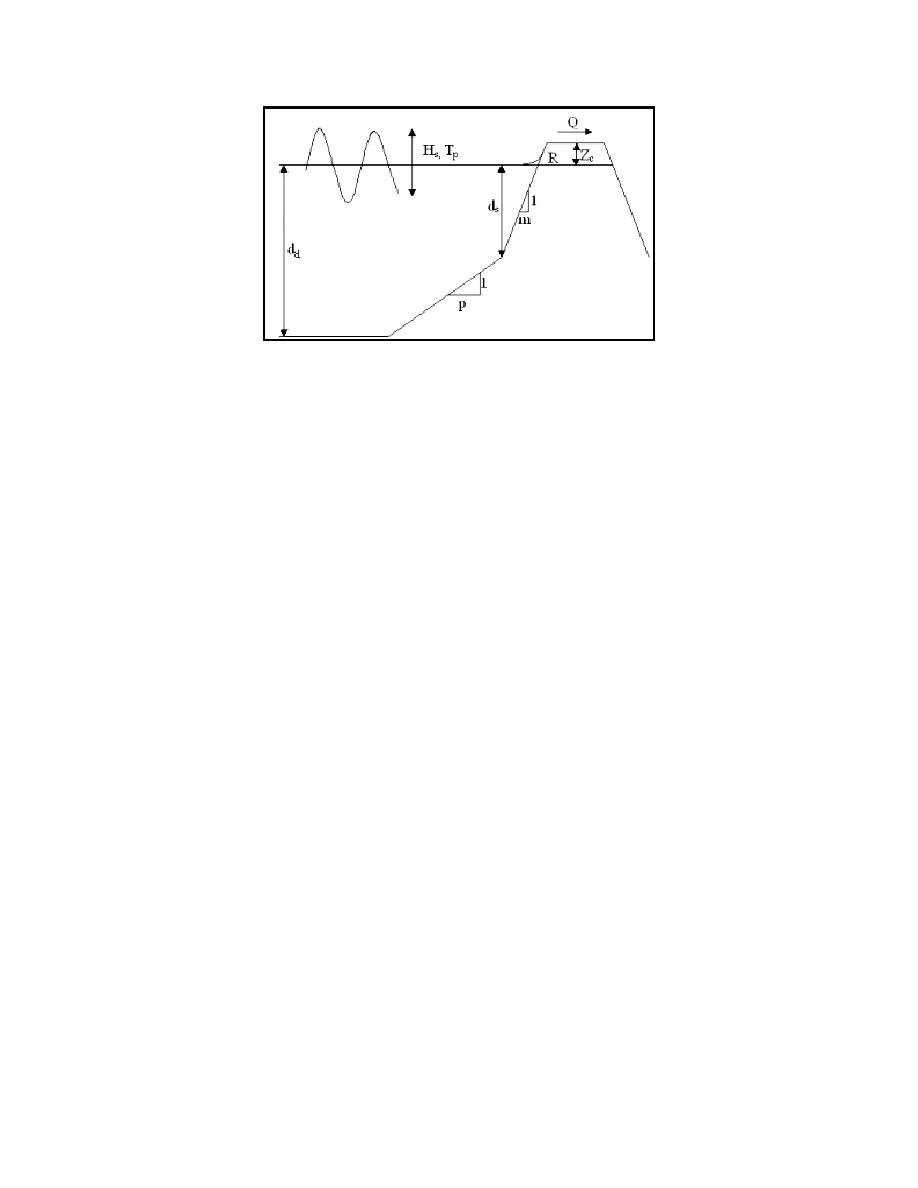
Figure 15. Profile shape generated by SMS for BOUSS-1D
The user enters a wave height and period along with the geometrical description of the structure.
These are the maximum depth (dd), toe depth (ds), crest elevation of the structure (zc), structure slope
(m) and a beach slope (p). Described here are the steps in applying BOUSS-1D to the estimation of
maximum wave runup situations.
The runup and overtopping calculator is accessed by selecting the BOUSS-2D|Calculators
command and choosing the 1D Runup and Overtopping tab (Figure 16).
The BOUSS-1D utility tries to predict wave-surface elevation time-history, from which estimates of
wave runup and overtopping are computed. For regular incident waves, the estimated runup is the
maximum runup, whereas for irregular waves, it is the R2%. The overtopping refers to the volume of
fluid passing over the crest width of the structure, which determines the amount of fluid arriving on
the backside of the structure.
As an example, if the user enters the values shown in Figure 16, and click on the Calculate button,
SMS will create the input file for the simulation and bring up a prompt asking for the version of
Boussinesq model to run. Select BOUSS-1D to run and click OK button. At this point SMS launches
BOUSS-1D and displays the progress. This may take 10 to 20 sec to run. The model wrapper
indicates the model run is complete and the user selects the Exit button. The runup and overtopping
values appear in the bottom section of the calculator.
It should be pointed out that the Boussinesq equations on which the model is based implicitly
assume that the seabed or structure slope is mild, relative to the characteristic wavelength. When
SMS constructs the input file, the wavelength at the toe is compared to the wetted length of the
structure. If the mild slope assumption is violated (i.e., a characteristic wavelength cannot fit on the
structure, SMS modifies the slope term "m" to be a maximum value computed as the wavelength at
the toe of the structure divided by 2 times the depth at the toe of the structure. In this case, a message
will be echoed to the screen indicating that the mild slope assumption was violated and the predicted
runup value may be not reliable or less accurate. If the model fails, it returns a value of 0.0 for runup.
For the mild slope structures (1:6 and 1:10 slopes) tested in the Saville experiments (Saville 1955),
the BOUSS-1D model predicted values of runup are generally within 20 percent of the physical
model data. The prediction of runup can be improved by calibrating the model with the experimental
data.
15

 Previous Page
