
ERDC/CHL CETN-IV-23
March 2000
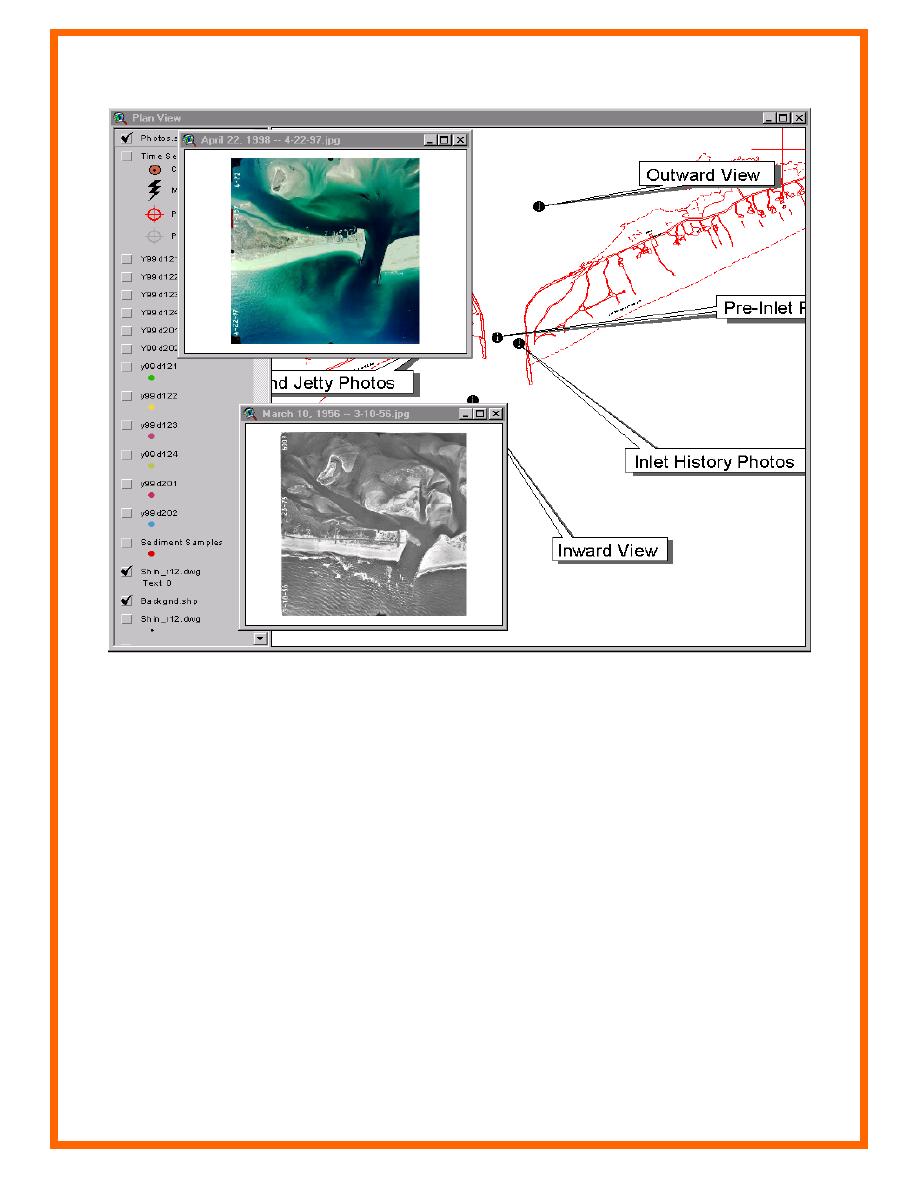
Figure 4. Shinnecock Inlet GIS project utilizing HyPAS tools for displaying photographs
The user can click to create a location for time-series data and import the data for that location.
Later the user can choose that location and HyPAS will display all the data types, which have
been imported.
HyPAS will plot the data on an x,y plane using the plot and axis information given by the user.
HyPAS automatically exaggerates the y axis to fit an 8.5 x 11 landscape plot. Figure 5 shows a
time-series plot of wind speed information.
6

 Previous Page
