ERDC/CHL CETN-IV-23
March 2000
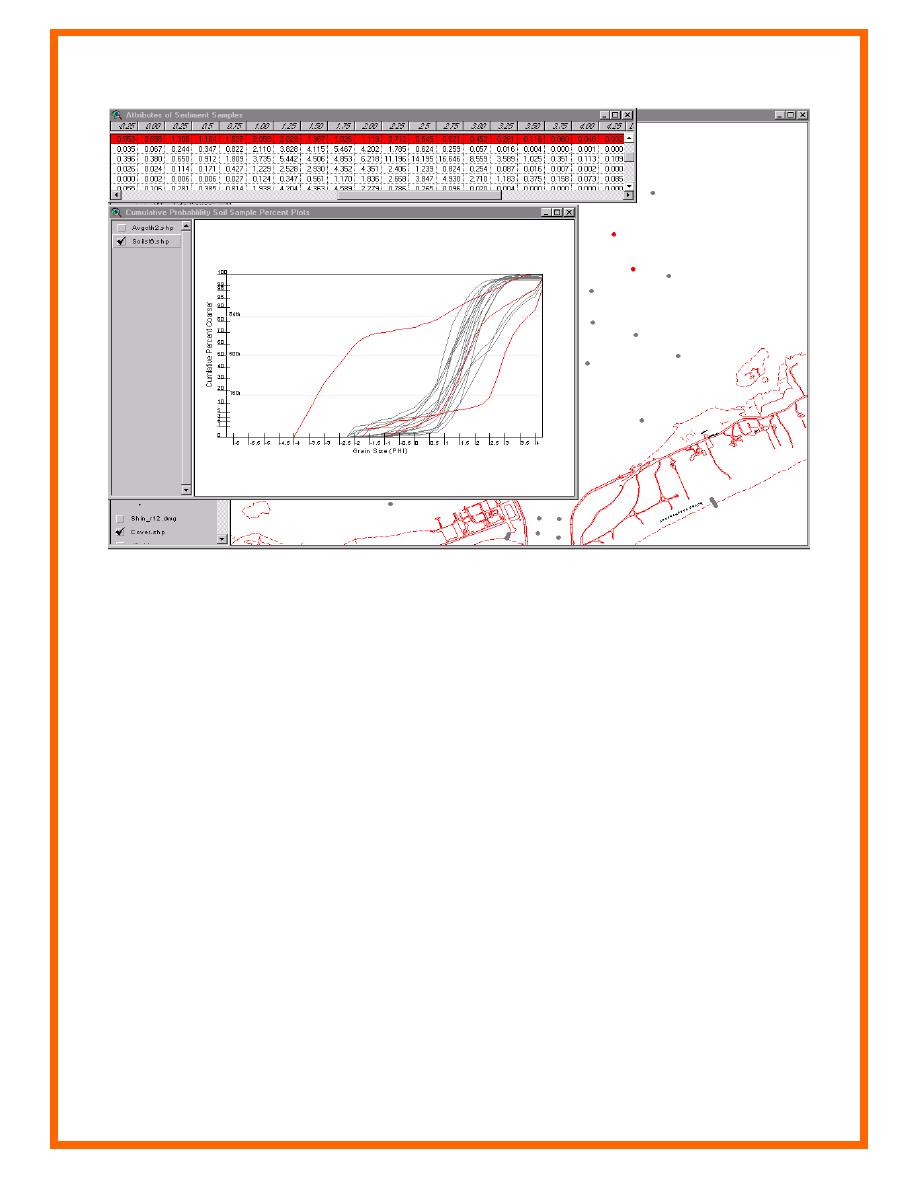
Figure 6. View showing link between distribution plots and plan view data
Once sediment samples are imported, the user must select the samples desired for a grain-size
distribution plot before selecting the Sediment Sample Tool. The option to plot the cumulative
frequency weight percents, the frequency weight percent histogram, or a composite sample plot
is provided. HyPAS then generates the distribution plot. Figure 7 shows frequency weight
percent histograms with a composite histogram from a subset of sediment samples collected
from the Shinnecock Inlet. A cumulative frequency weight percent plot of the same sample is
also shown. The thicker line delineates the composite sample. Various statistical parameters
describing this composite sample are stored to a table. These statistics include the median, other
percentiles, the Fill Factor (RA ), and the Renourishment Factors (RJ). Different composites can
then be easily compared. See Hands and Chu (1986), ftp://redarrow.cerc.wes.army.mil/
ftp/pub/pub/pdf/cetnii-15.pdf, for a discussion of the RA and RJ. The broader aspects of coastal
sediments, including their composition and fall velocity, are discussed by King (1999),
http://www.usace.army.mil/inet/usace-docs/eng-circulars/ec1110-2-292/c-1.pdf.
8


 Previous Page
