
ERDC/CHL CETN IV-23
March 2000
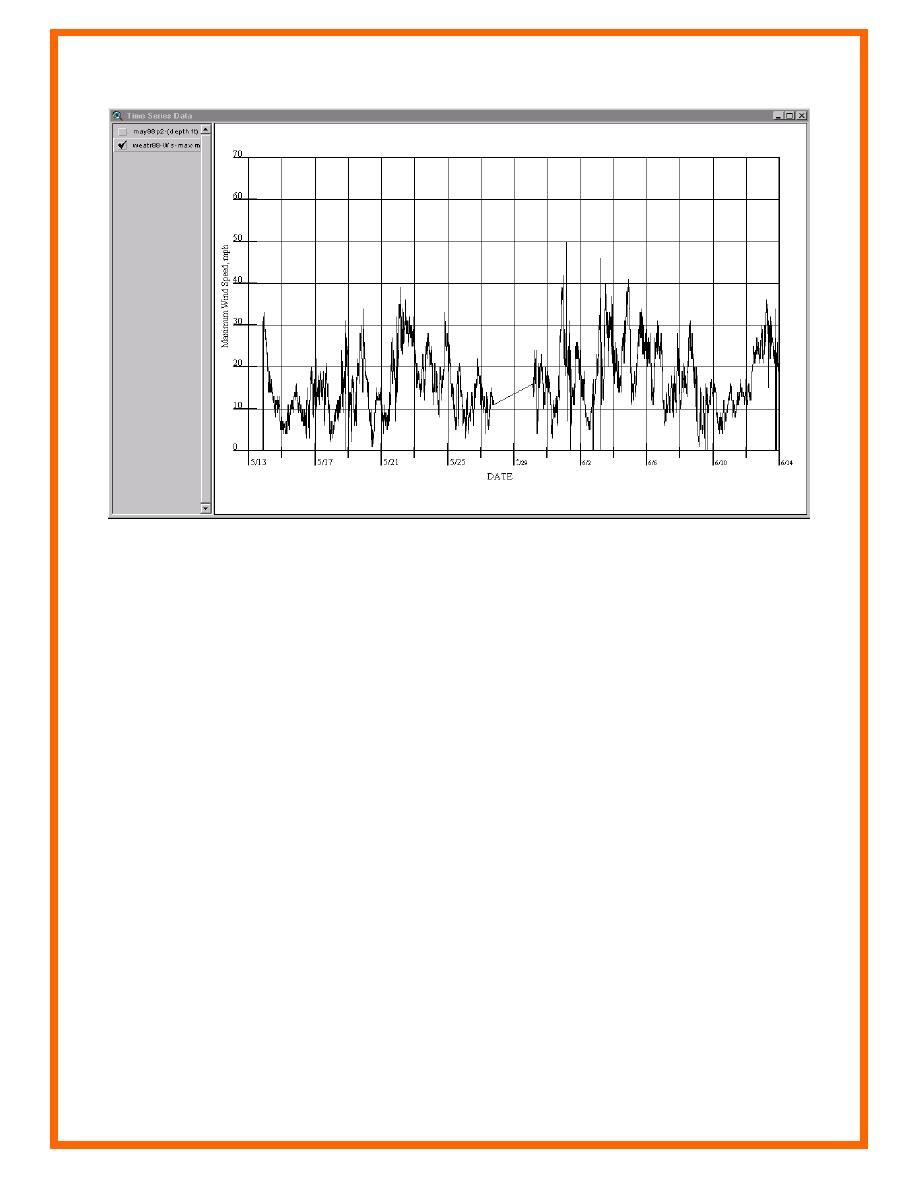
Figure 5. Maximum wind speed time-series data plot
SEDIMENT SAMPLE ANALYSIS TOOLBOX: HyPAS provides capabilities for analyzing
sediment samples and similar data. The user can plot cumulative frequency weight percent or
frequency weight percent histograms. HyPAS keeps these plots linked with the data in plan view
as well as tabular view.
The user can then select certain samples in the plot and see those specific samples highlighted in
plan and tabular views. This linkage works in all three views such that any selections including
tabular queries are reflected in the other two views. The user can select samples in any of the
windows, and the other two windows will show the selection.
Figure 6 shows the linkage between a frequency weight histogram plot with the plan view and
tabular data view. Note the selected (red colored) samples in all three views.
PLOTTING GRAIN SIZE DISTRIBUTION: HyPAS provides the capability of plotting grain-
size distribution for sediment sample data. The user can plot cumulative frequency weight or
frequency weight percent histograms. HyPAS can plot all samples selected or calculate a
composite for the selected samples. The user has the option of sorting the tabular data before
making a selection of samples for display in the plotting window.
7

 Previous Page
