
ERDC/CHL CHETN-II-45
March 2002
Although the Ahrens formulation may not adequately account for the crest width of some
submerged structures, it performs well for the Grays Harbor spur. This result suggests that the
relative submergence of a structure is the primary variable determining transmission. The
effectiveness of the Ahrens equation also supports Daemen's (1991) conclusion that reef
breakwaters should be treated separately from conventional structures. The Ahrens formulation
is applied to model shoreline response to the spur at Grays Harbor.
Simulation Results. The GENESIS model for Grays Harbor was calibrated to reproduce
shoreline change observed between September 1976 and August 1985 and verified for the time
period September 1985 through August 1995 (Wamsley and Hanson, in preparation). The spur
was then modeled as a 500-m long detached breakwater in GENESIS. The time-varying water
level file required for computing the transmission coefficient was created by input of local tide
data. The year 2000 shoreline served as the initial shoreline and a 4-year simulation was run
using the Ahrens transmission formulation. A 4-year simulation with constant Kt was also run to
assess the significance of varying Kt with the waves and water level. The average Kt = 0.85
computed by the Ahrens formula for the 4-year record was assigned for the constant-Kt
simulation.
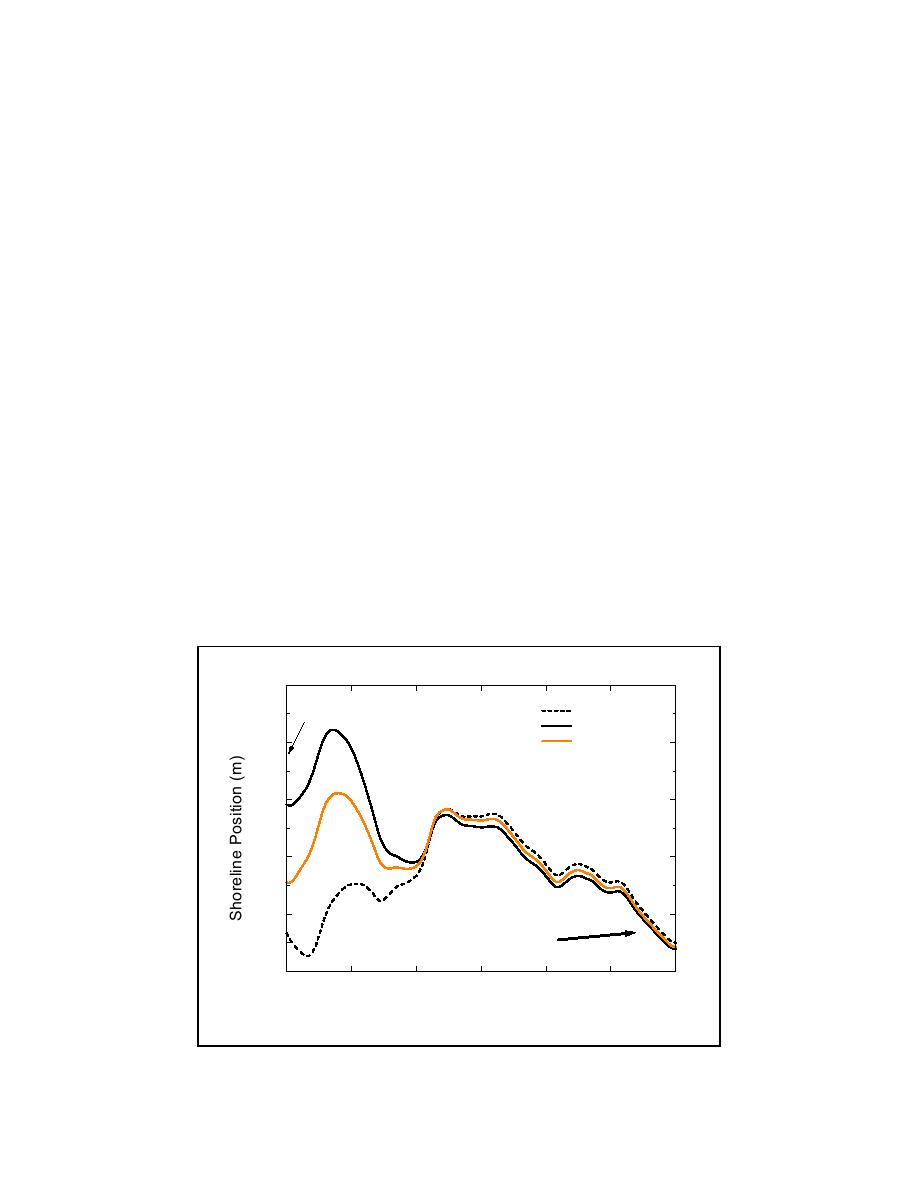
The predicted shorelines, together with the 4-year simulated shoreline without the spur, are
plotted in Figure 10. Both the Ahrens formulation and the constant Kt predict accretion behind
the spur with 10 m or less of updrift recession compared to the no-spur simulation. Presence of
the spur also alters the shoreline orientation within 1 km of the jetty. Without the spur, the
shoreline orientation near the jetty is approximately 2 deg west of north. A variable Kt reorients
the shoreline to 4 deg east of north, whereas a constant Kt predicts a shoreline orientation near
the jetty of due north.
1050
No Spur
North Jetty
Ahrens
1000
Constant Kt
Pacific Ocean
Vertical Exageration 12X
950
900
Ocean Shores
850
N
800
0
500
1000
1500
2000
2500
3000
Distance from Jetty (m)
Figure 10. Predicted shoreline positions
11

 Previous Page
