
ERDC/CHL CHETN-IV-35
June 2001
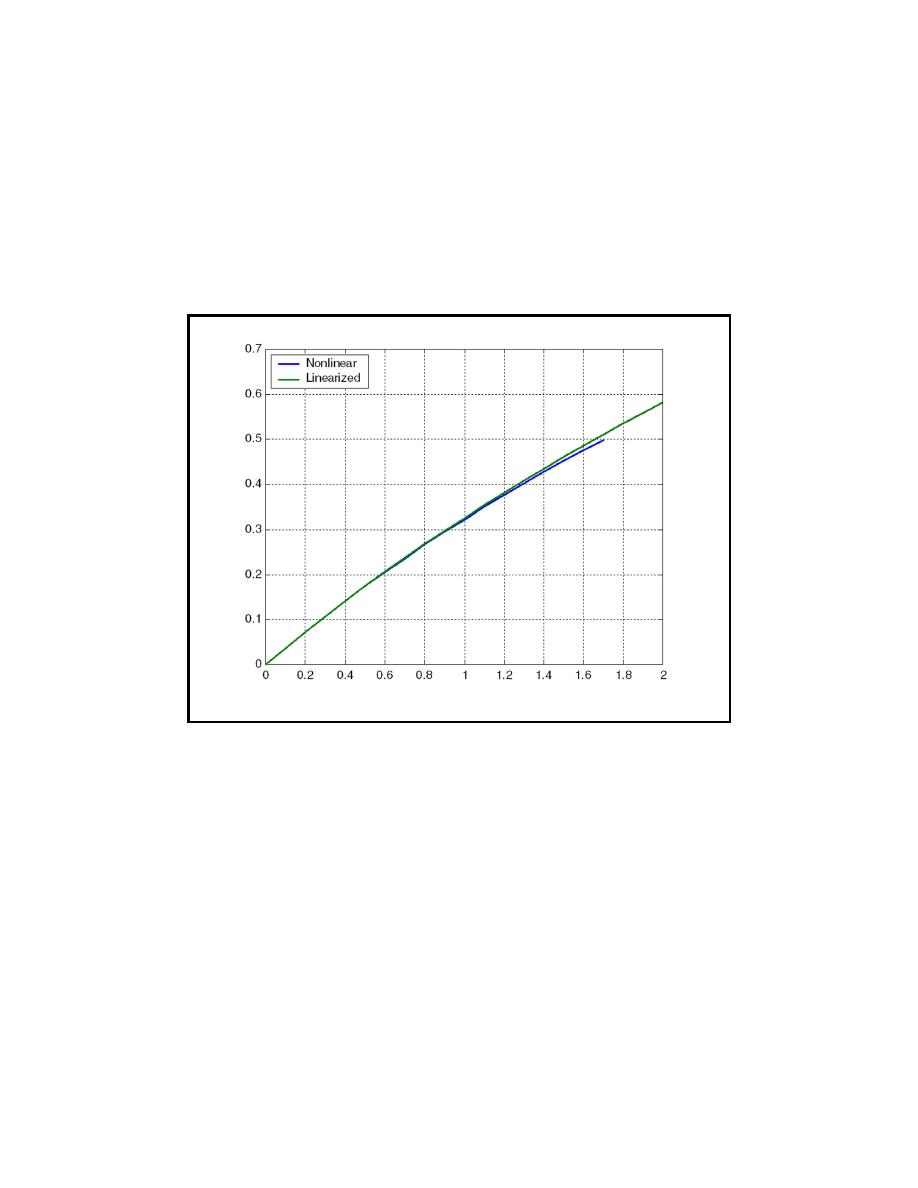
Figures 3 and 4 compare calculations with the numerical model and the linearized model. For
short elapsed time there is agreement, with deviations occurring after about 0.6 to 0.8 year for
this example. After 1.7 years, project depth (z = za) was reached, and the numerical model
stopped.
Figure 5 shows the time evolution of the channel infilling rate qcR and the bypassing rate qbR,
normalized by the input qR. The total adds to unity at any given time. The rate of bypassing
exceeds the channel infilling rate approximately 0.6 years after dredging.
Figure 3. Incr

 Previous Page
