ERDC/CHL CHETN-I-66
June 2002
nearshore runs can be initiated using a single offshore, coarse-grid output to represent multiple
nearshore bathymetries (i.e., project alternatives), water levels, or current fields, and b) the same
interpolation techniques can be applied to nearshore model input from other models, databases
(Wave Information Studies), or even field measurements. The key change to STWAVE for grid
nesting is implementation of a subroutine that interpolates spectra from a coarse spatial resolution to
a fine resolution on the nearshore grid boundary. Two interpolation options are available in
STWAVE:
Linear Interpolation. The most straightforward interpolation method is linear. The energy
density for each wave spectrum frequency-direction bin on the fine grid offshore boundary is bi-
linearly interpolated from the same bins of the adjacent spectra on the coarse grid. The bilinear
interpolation weights the spectra based on the relative spatial separation distances. If points saved
from the coarse grid are sufficiently dense to define the variation in the spectra along the nested grid
offshore boundary, linear interpolation gives good results.
2
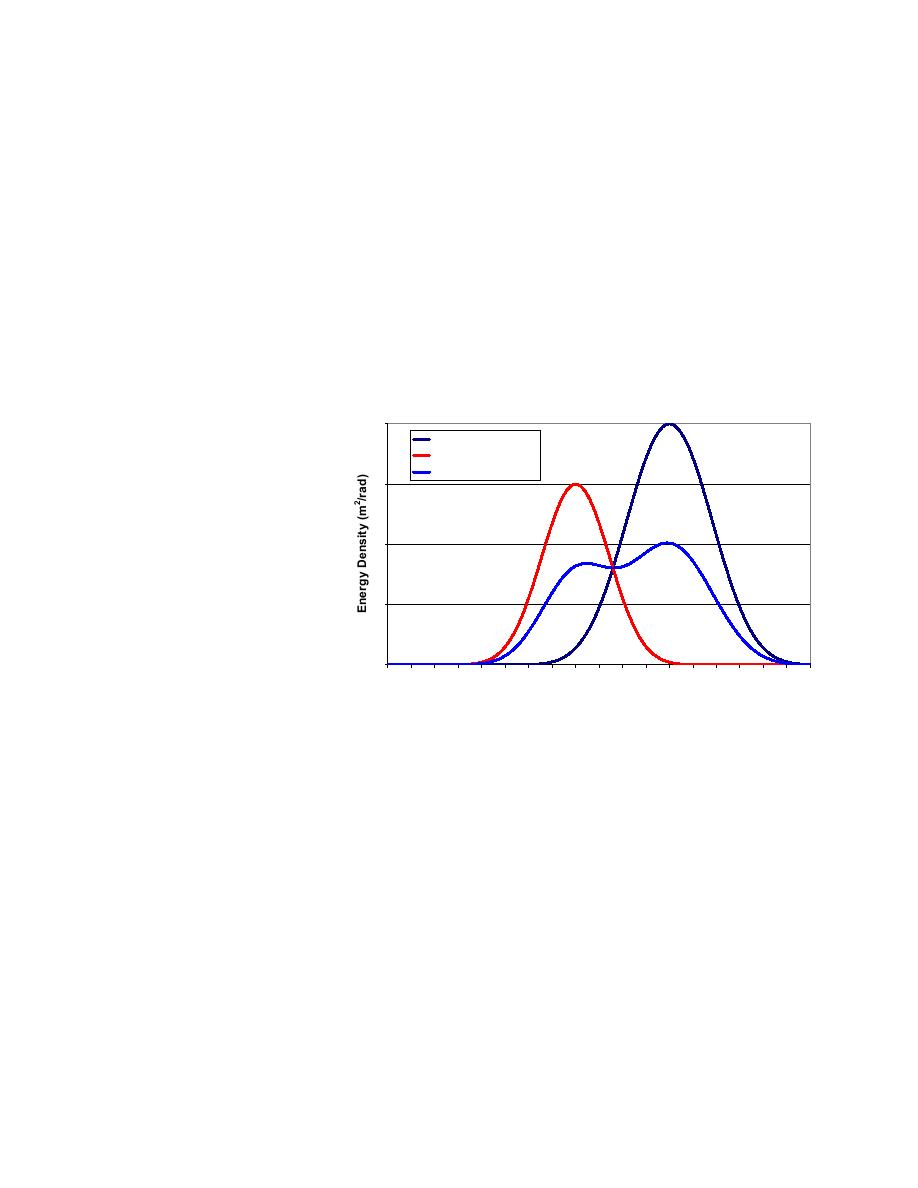
Morphic Interpolation. If
Distribution 1
wave directions vary by
Distribution 2
10-15 deg or more from grid
Linear Interpolation
1.5
point to grid point on the coarse
grid, linear interpolation can
cause smearing or even splitting
1
of the directional distribution.
Figure 1 shows an example of
linear interpolation of two
0.5
directional distributions with a
40-deg difference in peak
direction. Although this is an
0
extreme case, it illustrates a
-90 -80 -70 -60 -50 -40 -30 -20 -10
0
10
20
30
40
50
60
70
80
90
Direction (deg)
potential problem with linear
interpolation for cases where
Figure 1. Linear interpolation of directional distribution
either the coarse-grid spectra
are widely spaced or the bathymetry is very complex. To preserve the shape of the directional
distribution, a morphic interpolation method was developed.
The morphic interpolation includes the following steps:
Directional distribution for each frequency is interpolated from a 5-deg resolution to a 1-deg
resolution using a cubic-spline interpolation. This allows better directional accuracy for the final
interpolated directional distributions.
As illustrated in Figure 2 (with the two input distributions shown in Figure 1), the peak direction
is removed from the directional distribution, so that the resulting peak directions are zero.
The directional distribution is bilinearly interpolated as shown in Figure 2.
The peak direction is bilinearly interpolated from the peak direction of the two input directional
distributions, and the interpolated distribution is shifted to the calculated peak direction
(Figure 3).
These steps are repeated for each frequency in the spectrum and then the directions are
decimated back to the standard STWAVE 5-deg resolution.
2


 Previous Page
