
CETN IV-17
March 1999
0
-10
-20
-30
-40
-50
-60
0
500
1000
1500
2000
2500
X (ft)
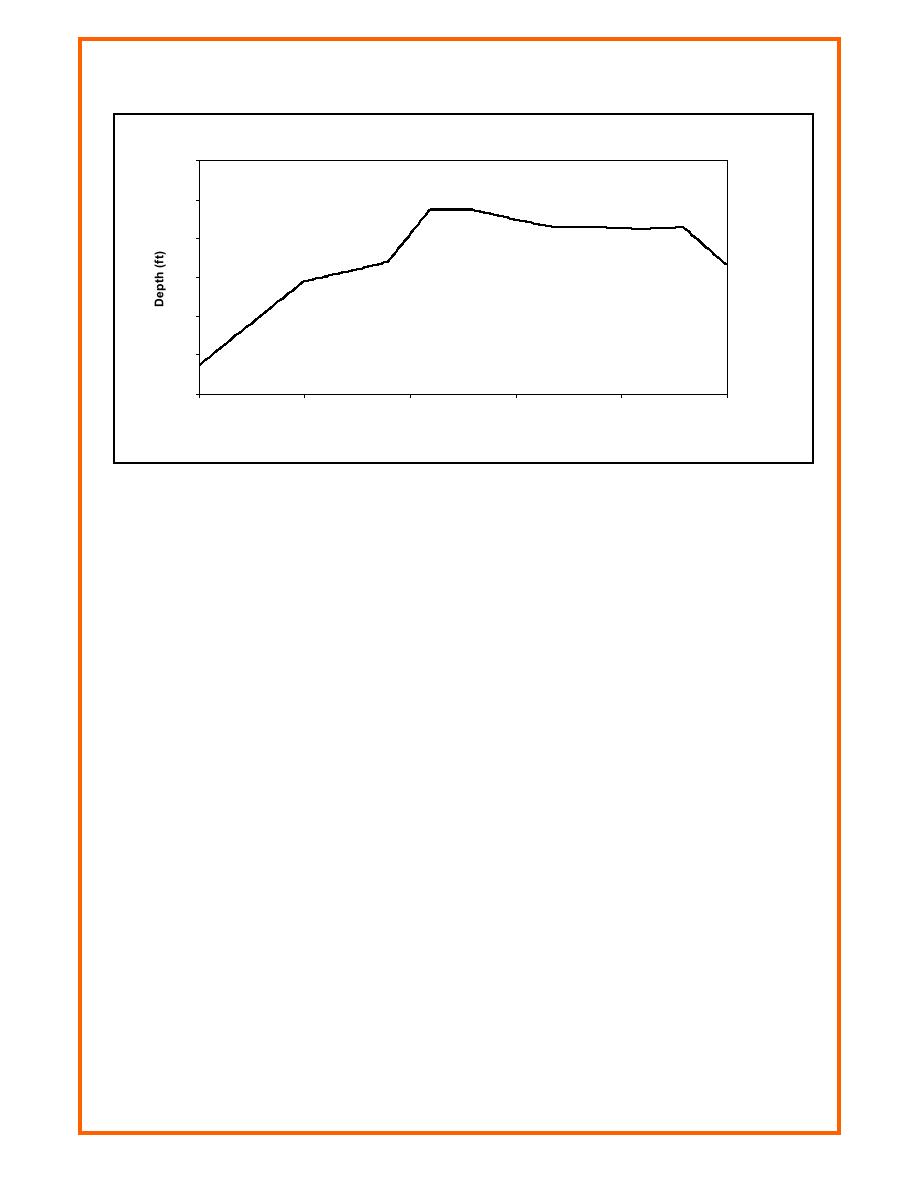
Figure 2. Depth profile for Example 2 scaled laboratory case
Find: Hmo across the ebb shoal and between the jetties.
Given: Incident wave conditions of Hmo = 9 ft, and Tp = 10 sec and 5 sec; maximum ebb current
U = -6 ft/sec, and bathymetry given in Figure 2.
The wave heights were modeled by applying one-dimensional wave-current interaction using the
incident wave condition (where U = 0) and local measurements of water depth and current speed
at each computation point. Wave height at each point is limited by the breaking criterion given in
Equation 4. The wave-height results are plotted in Figures 3 and 4. In addition, wave height
calculated using one-dimensional wave-current interaction, but limited by applying a depth
criterion:
Hmo = 0.6d
(9)
is also plotted in the figures for reference. Equation 9 is a typical depth-limited breaking criterion
for a spectra wave model (note that the coefficient is less than the typical monochromatic value of
0.78).
These two cases reflect weak and strong wave-current interaction. Weak interaction is illustrated
in Figure 3 with incident wave conditions Hmo = 9 ft and peak period of 10 sec and maximum
current of -6 ft/sec (negative indicates ebb flow). Wave-current interaction shoals waves with
short wave periods more strongly than waves with long periods, but depth-induced shoaling is
greater for long-period waves. The maximum velocity occurs between the jetties (x > 1,500 ft)
and decreases offshore. The wave-current interaction is weak in this case because the wave
6

 Previous Page
