CETN IV-18
March 1999
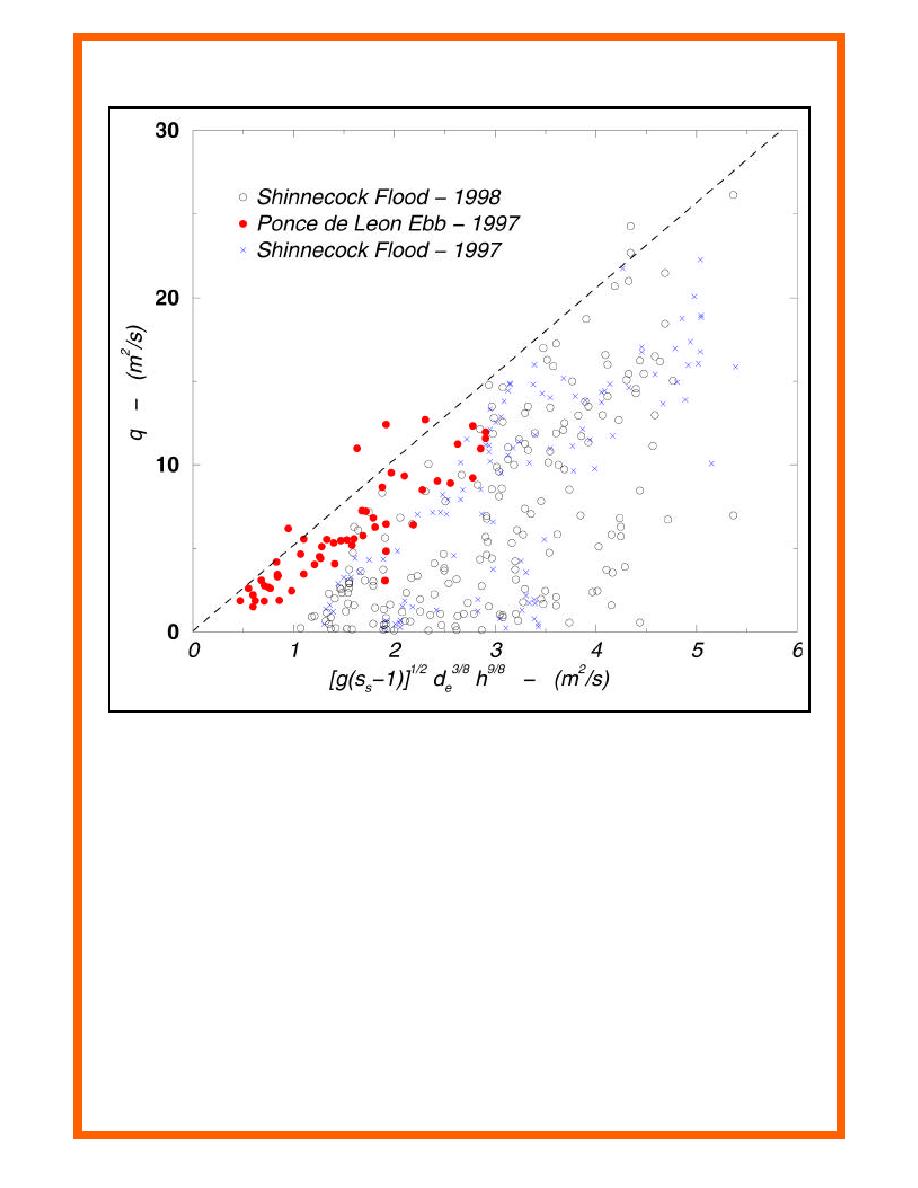
Figure 1. Field data from two dual-jettied inlets
Another explanation for data scatter below the dashed line is that depths at some of the locations
are scoured by a different cross-channel flow distribution that occurs during the reverse
maximum tidal flow. Finally, there is the possibility that some of the depths are the result of
scouring that occurred during episodic events such as storm surges or river discharge combined
with ebb flow. Regardless of the reason, depths associated with data points below the dashed
line are not in equilibrium with the measured discharge. In other words, these depths would be
able to accommodate increased flow discharge without additional scouring of the bottom.
The dashed line in Figure 1 corresponds to Ce = 5.12 in Equation 4, which can now be expressed
as an empirical equation for equilibrium maximum discharge per unit width, i.e.,
qe = 5.12 [g (S s - 1)]
1/ 2
d e3 / 8 h 9 / 8
(6)
4


 Previous Page
