Home
Download PDF
Order CD-ROM
Order in Print
Home
>
Coastal Engineering
>
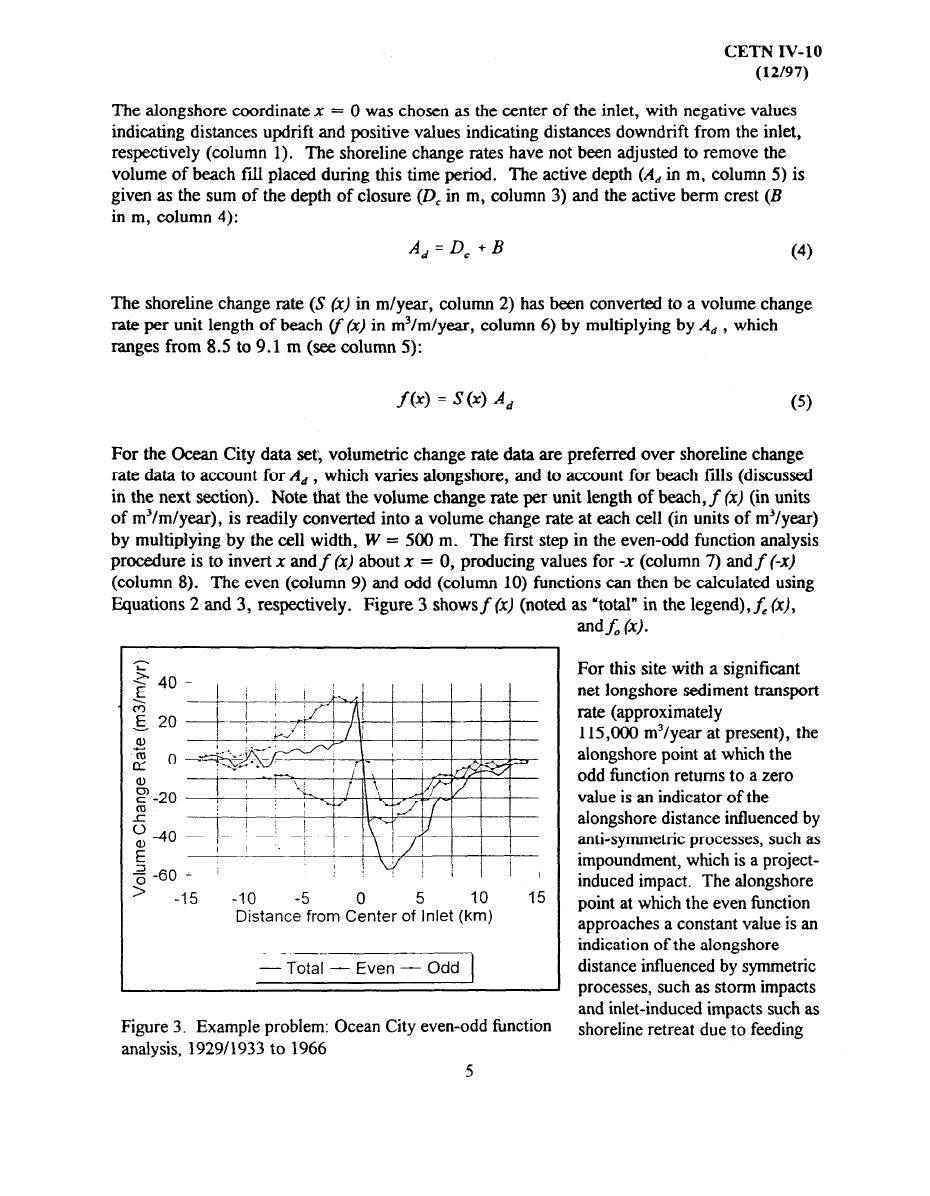
> Figure 3. Example problem: Ocean City even-odd Function analysis, 1929/1933 to 1966 - cetn-iv-100005
Table 1. Shoreline Change Rate Data for Shoreline Adjacent to Ocean City Inlet, Maryland: Nov 1929 and May 1933 to May 1996 - cetn-iv-100004
Figure 4. Ocean City even-odd function analysis, 1929/1933 to 1996, adjusted for beach fill - cetn-iv-100006
cetn-iv-10
Page Navigation
1
2
3
4
5
6
7
8
9


 Previous Page
