Home
Download PDF
Order CD-ROM
Order in Print
Home
>
Coastal Engineering
>
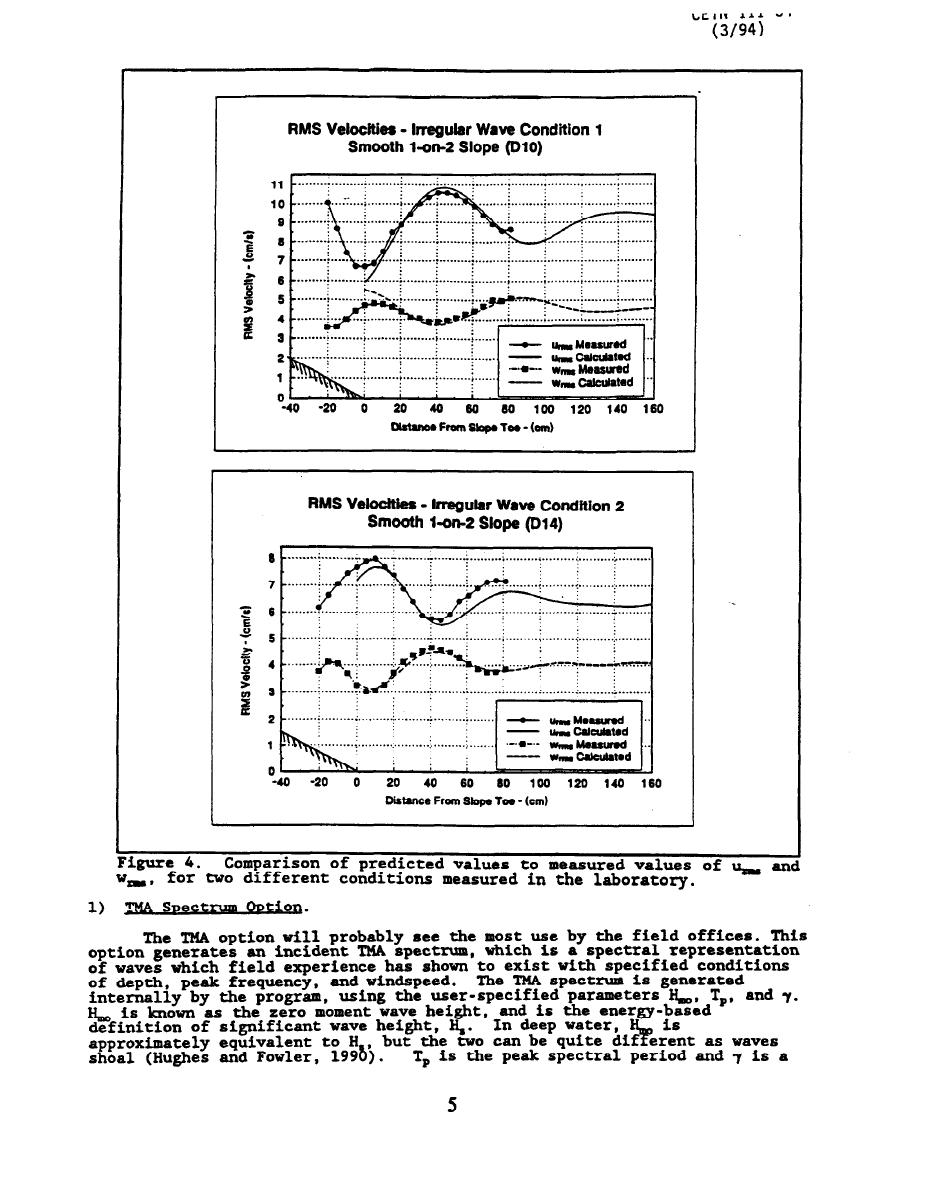
> Figure 4. Comparison of predicted values tomeasured values of u and w, for two different conditions measured in the laboratory
Figure 5. Initial intercative screen displayed in Shrareware program
User-Supplied Spectrum Option
cetn-iii-54
Page Navigation
1
2
3
4
5
6
7
8
9
10


 Previous Page
